It goes like this: let's say the students are learning to solve linear equations in one variable. Each student gets a worksheet with 10 boxes on it, and in each box is an expression, such as "3x" or "2 - 5x" or "x - 10x" or "5". For variety, I might make three or four versions of this worksheet, but it's not necessary for everyone to have a unique worksheet.
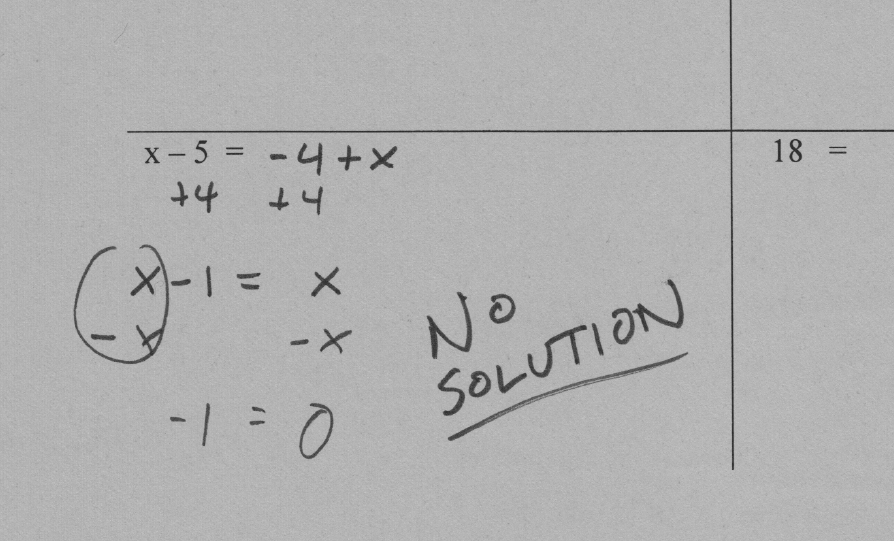
Now the students are required to get up and start networking with each other. (Some groaning.) Each student finds someone to work with. Let's say Dave is working with Lisa. Dave chooses an expression on his page to use, and so does Lisa. Dave writes Lisa's expression next to his own, and puts an equal sign between them; Lisa does the same with Dave's expression on her own paper. That way, Dave has the same equation on his paper that Lisa has on hers, only the sides of the equation are swapped. Dave and Lisa work together to solve the equation, making sure they check that they got the same answer:
 |
| Dave's paper: Dave's expression equals Lisa's expression. |
 |
| Lisa's paper: Lisa's expression equals Dave's expression. |
Or it might occur that they construct an equation that is a false statement, or possibly even an identity.

Then Dave and Lisa split off and find new people to work with. In this way, each person in the class works with 10 other people in the class.
That, anyway, is the theory. In practice, the biggest problem I've had with it is that certain students are likely to circumvent the requirement to actually work with each person as they roam around. For example, instead of working through the problem with Lisa, Dave might be inclined to ask her for an expression, write it down, and then immediately abandon Lisa and move on to Josh, either solving the equations quickly as he roams or just laying them all out before he even begins to solve them. Sometimes I've seen students try to stay seated and call out to their classmates around the room to get the necessary information!
So, of course, it doesn't run by itself- I have to float around and make sure it's really happening as I intended. But the benefits are pretty clear. If I'm a student who doesn't know how to solve a linear equation, it's going to give me some confidence to see one of my peers doing it (more than simply watching the teacher would); this activity simply gives me that benefit over and over again. It's also a kind of community building activity, because they can actually be face to face with many different people in the class that they might otherwise never talk to. And, not least of all, this activity (along with other formats, which I will share soon) gives me a way to avoid having everyone working solo on problem sets at their desks, something I don't mind doing occasionally but would never do routinely.
Roaming is quite adaptable- I've used it for many different concepts and purposes. For example, if we're practicing slope, each student could be given a single x-y pair, and then two students could find the slope of the line connecting their two points. The same student can use the same point over and over again and get a different result with every new partner.
The concept of roaming first occurred to me when I had a classroom with a nice 8-inch square tile floor. All math classrooms need to have a square tile floor. It is a low-tech way to make graphing into a kinesthetic experience. I used that floor to teach graphing in all kinds of ways, either by placing laminated dots or taping down twine.
Eventually, I realized that if each student were responsible for a single line graphed on the floor, the lines would intersect multiple times, creating a problem set; any two lines formed a system of linear equations, and if the students were to solve each system algebraically, they could check their work by locating the actual intersection point on the floor to see if it matched.
I gave them instructions something like this:
Directions
1. Graph the line given to you above with
your piece of twine and tape.
2. Using another piece of tape, label your
line with your name. (Do this on the edge somewhere, where it won’t get in the
way.)
3. As other classmates graph their lines,
find someone whose line crosses yours. The two of you can then put your
equations together as a system and find an exact solution (with algebra) for the point of
intersection.
For each
system, be sure to consider:
Is
it better to solve this system by elimination or by substitution?
4. Record your work on each system, and
write each person’s name by the system they were a part of.
5. Once
you find a solution, use a sticky note, placed under the twine, to label the
point of intersection.
By the end of the class, we've got a whole lot of lines on the floor and a whole lot of points marked, and it looks pretty great.


You'll notice that several of the lines are parallel. That's because we don't want to have too many intersections or it gets out of hand. It's best to map out exactly what you want the finished picture to look like ahead of time. That way, you can have the picture in front of you as the students lay down the twine, and if something doesn't look right you can easily identify the error.
This activity has only crashed and burned once. What that class really required was some careful coaching by example before we even got started. They didn't understand what to do and were too resistant to simply learn by doing.
Every other time, however, this has been a success. Some classes understand what I'm after right away and jump right into it; others need lots of explanation and prodding, but once things get rolling it's a smooth ride. And it's not unusual for a student to say something like, "Hey, can we do stuff like this every day?"

